
Chrome extension 是非常強大的工具,可以做到非常多的事情。
但也因此它提供的執行環境(我稱之為 context) 有非常多種,各有各的用處。為了能夠有效率且順利的在這些 context 內開發,必須了解各個 context 底下應該如何使用 Chrome DevTools 來進行 debug。
本文介紹 如何在各個 context 下讓 Chrome DevTools 為你所用。
Popup
這個是基本中的基本啦~ 在一些 Chrome extension 教學影片都會提到。
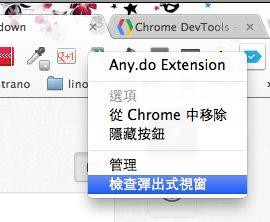
- 在該 Popup extension 的 icon 上面點擊滑鼠右鍵
- 選擇「檢查彈出視窗」即可
以 Any.do 為例

Background Pages
Background pages (含 event pages) 其實擺的位置有點神妙,但知道之後真的在 debug 十分方便。 Bug 出在 background pages 而沒打開 DevTools 來看看錯誤訊息的話,真的是霧裡看花毫無頭緒…
- 打開 Chrome extensions 頁面
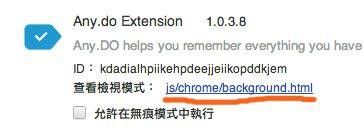
chrome://extensions - 在各個 extension 項目的下方有個 「查看檢視模式」,按下它右邊的連結
- 在跳出的 Chrome DevTools 裡切換到 “Source” 頁面
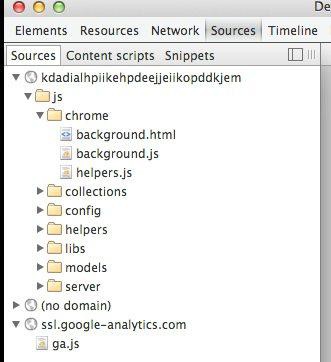
- 按開側邊欄,在 “Sources” 裡就可以看到 background pages 的 scripts
仔細看看跳出來的 Chrome DevTools,可以發現就算原本 extension 沒有 background.html (也就是擺的是 background.js 之類的),Chrome 也會自動生出一個 background.html 並在 <head> 裡擺上 background scripts,而這個 Chrome DevTools 就是對那頁 background.html 做 inspection。
以 Any.do 為例
Content Scripts(manifest.json)
Content scripts 與被 inject 的網頁可說是若即若離的關係,我們可以直接在 Chrome DevTools 裡找到使用 manifest.json 來 match 並 inject 的 content scripts。
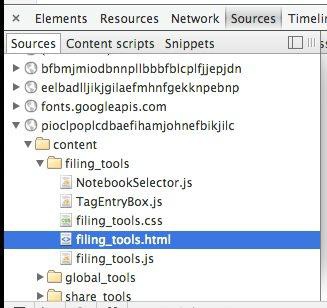
- 打開 Chrome DevTools,切換到 “Source” 頁面
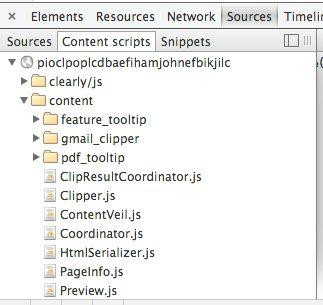
- 按開側邊欄可以看到 “Sources”, “Content scripts”, “Snippets”,切到 “Content scripts”
- 用 extension id 找到你的 extension 即可開始 debug
看看有多少 content scripts 是每個網頁都跑的…
以 Evernote Web Clipper 為例
Content Scripts(programmatic injection)
PI 的 content scripts 在上面任何一個地方都找不到它的身影,它只存在於動態 inject 後的 VM 裡,因此要讓它現身需要多花一點點功夫。
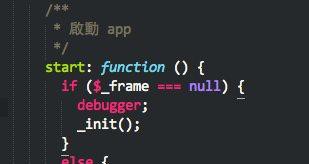
在這邊需要用到的是 Chrome DevTools 裡的 debugger keyword,讓動態 inject 的 script 直接觸發我的們的 DevTools,進而賜予我們使用 DevTools debugger 的能力。
- 在想要加入 breakpoint 的地方擺上
debugger - 打開 Chrome DevTools 並執行會觸發 programmatic injection 的動作
- breakpoint 隨你加啦
下面可以看到被 debugger break 的 script name 是 “VM403”。
以某 extension 為例

Content Scripts 載入的內容
Content scripts 另外再載入的內容(額外安插 script、iframe with scripts 等),基本上 debug 的方式就與一般的網頁差不多,而也會出現在一般網頁 source 會出現的欄位裡,不過是 domain name 不一樣罷了。
- 打開 Chrome DevTools,切換到 “Source” 頁面
- 按開側邊欄,在 “Sources” 裡找到你的 extension id
- 開始觀察與 debug
以 Evernote Web Clipper 為例
進一步閱讀
Chrome Extension 進階 - debug http://jzlin-blog.logdown.com/posts/2013/12/23/chrome-extension-advanced-debug
裡面提到一些使用 Chrome DevTools 來 debug extension 時的技巧,非常實用喔!